
1
Immense growth potential with healthy return ratios
Please refer to important disclosures at the end of this report
1
1
SBI Cards & Payment Services Limited (SBI Cards), a subsidiary of Sate Bank of
India (SBI), is a non-deposit taking NBFC and one among the two credit card
issuers registered as an NBFC and will become the only listed company in India in
this space. SBI Cards is the 2nd largest credit card issuer in India, with 18.1%
market share in terms of the number of credit cards outstanding as of November
30, 2019. SBI Cards offers various types of credit cards considering the need of
retail clients (viz. Lifestyle Cards, Rewards, Shopping, Travel and Fuel). It also
offers corporate cards and is the largest co-brand credit card issuer in India. It
also issue card in partnership with smaller or regional banks.
Immense growth potential given low penetration and large untapped SBI
customers: SBI Cards has grown its outstanding cards at healthy CAGR of 28%
over FY2015-19 while the industry grew at 23% over the same time. Furthermore,
we expect SBI Cards to continue to register healthy CAGR over FY2020-24 owing
to (a) Significantly underpenetrated Indian credit card market; number of credit
cards per 100 people is 3, whereas in developed/developing countries it is >30.
(b) As on Q3FY2020, credit card to debit card ratio was 3.7% for SBI Cards (vs.
peers viz. HDFC Bank – 45%, Axis Bank – 28% and ICICI Bank – 18%), which
clearly indicates huge scope for mining SBI Bank customers. (c) Total credit card
outstanding loan as % of banking sector loan is just 1.22%, and retail loan is
27%, indicating enough space to increase credit card loan book. (d) Credit card
spend as % of GDP for India is 3%, while that for other countries is >10%. All the
above factors clearly show that there is a huge room for credit card industry to
grow. We believe, with strong parentage and healthy capital adequacy, SBI Cards
should be able to growth at healthy CAGR and gain market share.
Healthy return ratios; stable asset quality despite strong advances growth: SBI
Cards has reported average ROE/ROA of 29%/4.3% over last 3 years. C/I has
declined from 63% in FY2017 to 60.5% in FY2019 and further reduced to 56.6%
for 9MFY2020. Spend base fees contributes 26% of total income and increase in
card spending will improve spend base fees, which will increase operating
leverage, aiding further reduction in C/I. Advances grew at CAGR of 34% over
FY2017-19, however asset quality remained stable in the range of 2.3–2.4%.
Outlook & Valuation: At the upper end of the price band, SBI Cards is valued at
45.5x of 9MFY2020 annualised earnings. Although the valuations are a bit on
the higher side, we are positive on the future outlook of the company given
favorable industry scenario, large untapped SBI Bank customers and strong
financial track record. We recommend a Subscribe to the issue.
Key Financials
Y/E March (` cr)
FY17
FY18
FY19
9MFY20
NII
1,360
2,048
2,559
2,527
YoY Growth (%)
51
25
PAT
373
601
863
1,161
YoY Growth (%)
61
44
EPS
4
6
9
17
Book Value
16
25
38
51
P/E
189
117
82
45
P/BV
49
30
20
15
ROE (%)
26
32
29
38
Source: Company, RHP, Angel Research; Note: Valuation ratios based at upper end of the price
band. 9MFY2020 EPS is annualised.
SUBSCRIBE
Issue Open: March 02, 2020
Issue Close: March 05, 2020
Offer for sale: `9,855cr
QIBs 50% of issue
Non-Institutional 15% of issue
Retail 35% of issue
Promoters 69.5%
Others 30.5%
Fresh issue: `500cr
Issu e Details
Face Value: `10
Present Eq. Paid up Capital: ` 932.3cr
Post Issue Sh areh oldin g Pattern
Post Eq. Paid up Capital: `939cr
Issue size (amount): *`10,290cr -
**10,355 cr
Price Band: `750-755
Lot Size: 19 shares and in multiple
thereafter
Post-issue implied mkt. cap:
*`70,422cr - **`70,891cr
Promoters holding Pre-Issue: 74%
Promoters holding Post-Issue: 69.51%
*Calculated on lower price band
** Calculated on upper price band
Book B u ilding
SBI CARDS AND PAYMENT SERVICES LIMITED
IPO Note | BFSI
Feb 27, 2020
2
Feb
27,
SBI Cards and Payment Services Limited | IPO Note
Feb 27, 2020
2
Comp Background:
SBI Cards is the credit card marketing and issuing arm of India’s largest bank, SBI.
The company was established in 1998 and since then it is offering various credit
card services matching the needs of different economic classes of the country. It
was incorporated as a joint venture between State Bank of India and GE Capital
Mauritius Overseas Investment. On December 15, 2017, GE Capital Mauritius
Overseas Investments sold its entire stake (40%) in the company to State Bank of
India (14%) and CA Rover Holdings (26%).
CA Rover Holdings: CA Rover Holdings, an affiliate of the Carlyle Group, currently
owns 26% of the total outstanding equity share capital. Carlyle Group is a global
investment firm having deep industry expertise with over $222 billion of assets
under management as of March 31, 2019.
SBI Cards is the 2nd largest credit card issuer in India, with a 17.6% and 18.1%
market share of the Indian credit card market in terms of the number of credit
cards outstanding as of March 31, 2019 and November 30, 2019, respectively,
and a 17.1% and 17.9% market share of the Indian credit card market in terms of
total credit card spends in fiscal 2019 and in the 8 months ended November 30,
2019, respectively, according to RBI.
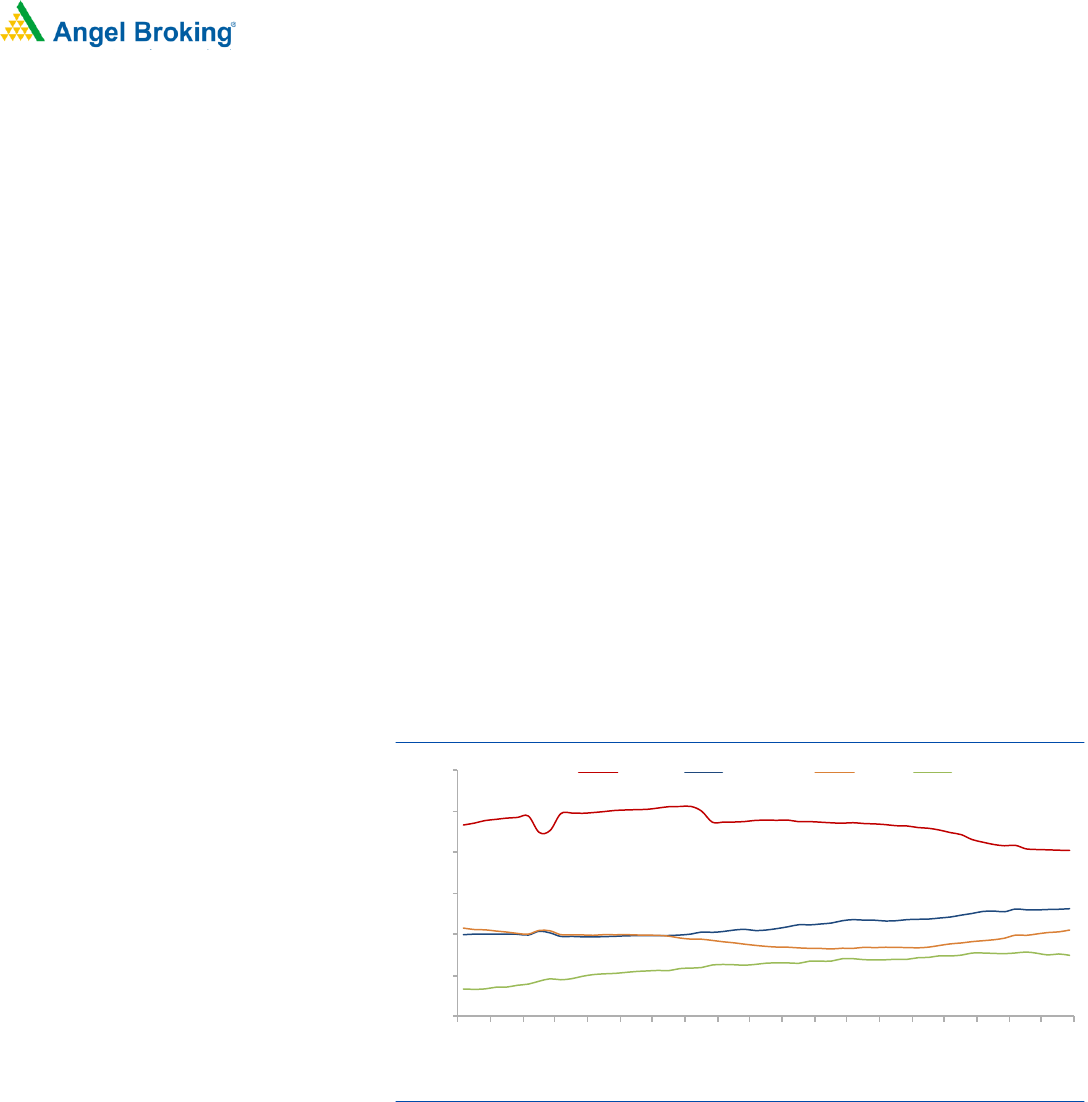
Exhibit 1: % of Cards in Force
Source: Company, RBI
How does SBI Cards earn revenue and other income?
The revenue that SBI Cards derives from its credit card products consists primarily
of interest on its credit card receivables and non-interest income primarily
comprising of fee-based income such as interchange fees (i.e. fees received from
credit card payment networks such as MasterCard, Visa and RuPay), late fees,
annual credit card membership fees and other fees.
A typical credit card transaction begins when a cardholder purchases goods or
services from a merchant using its credit card. After the transaction is authorized by
the credit card issuer through the payment network, the credit card issuer pays the
purchase amount to the payment network net of interchange fees. The payment
28.3%
25.2%
15.0%
18.1%
15.7%
15.5%
8.3%
12.4%
5%
10%
15%
20%
25%
30%
35%
Apr-15
Jul-15
Oct-15
Jan-16
Apr-16
Jul-16
Oct-16
Jan-17
Apr-17
Jul-17
Oct-17
Jan-18
Apr-18
Jul-18
Oct-18
Jan-19
Apr-19
Jul-19
Oct-19
HDFC
SBI Cards
ICICI
AXIS

3
Feb
27,
SBI Cards and Payment Services Limited | IPO Note
Feb 27, 2020
3
network, in turn, then pays the purchase amount to the acquirer. Finally, the
acquirer pays the purchase amount to the merchant net of acquirer fees.
SBI Cards earns interest income on “revolver” receivables, “transactor” receivables
and “term loan” receivables. Revolver receivables are characterized by balances,
which are carried over from one month to the next and, consequently, accrue
interest charges. Transactor receivables are characterized by balances, which are
paid in full every month by the due date and, consequently, do not accrue any
interest charges. Term loan receivables are comprised of equated monthly
installment balances.
Other income comprises of income from fees and services, services charges,
business development incentive income, insurance commission income.
Income from fees and services: Income from fees and services primarily relates to
the various types of credit card fees and charges that it generates from its
operations.
Subscription-based fees: Subscription-based fees primarily consist of credit
card membership fees and annual credit card fees that it charges its
cardholders.
Spend-based income: Spend-based income primarily consists of the
interchange fees that it earns as consideration for the transactions carried out
by its cardholders using its credit cards.
Instance-based fees: Instance-based fees primarily consists of a wide range of
fees that it charges its cardholders, including late fees, reward redemption
fees, cash withdrawal fees, over-limit fees, payment dishonor fees, processing
and statement retrieval charges, among others.
Service charges: Service charges primarily comprise of commission from selling of
third party products (like card protection plans).
Insurance commission income: Insurance commission income is comprised of
commissions or incentives that it earns as a corporate insurance agent in selling its
partners’ insurance products to its cardholders.
Exhibit 2: Revenue from operations mix – FY19
Particular
%
Net Interest Income
40.8
Other Income
10.2
Other Income-Misc
4.6
Service .Charges
2.0
Business development incentive income
3.5
Insurance commission income
0.1
Net gain on fair value changes
0.0
Income from fees and services
49.0
Subscription-based fees
6.9
Spends-based fees
26.2
Instance-based fees
15.8
Source: RHP

4
Feb
27,
SBI Cards and Payment Services Limited | IPO Note
Feb 27, 2020
4
Exhibit 3: Income from fees and services mix – FY19
Particular
%
Income from fees and services
100
Subscription-based fees
14.8
Spends-based fees
51.0
Instance-based fees
34.2
Source: RHP
Key Management Personnel:
Mr. Hardayal Prasad is the Managing Director and CEO of SBI Cards and
Payment Services. He holds a Masters degree in Chemistry from Agra College and
is a certified associate of Indian Institute of Bankers. He has handled several
assignments for SBI in various locations in India and abroad. He has been a part
of SBI since 1983 and has 36 years of experience in the banking industry.
Mr. Richhpal Singh, COO of the company, is a bachelor in arts from Maharshi
Dayanand University, Rohtak. He was associated with the erstwhile SBIBPMSL
(previously known as GE Capital Business Process Management Services Private
Limited) since December, 2017. Previously, he was associated with Jio Payments
Bank Limited and SBI.
Ms. Aparna Kuppuswamy, Chief Risk Officer of the company is a Masters in
Finance and Control from the University of Delhi. She was associated with GE
Money Financial Services for one year and was then transferred to SBI Cards in
April, 2009. Previously, she was associated with American Express Financial
Advisors, Bank of America and ABN AMRO Bank.
Mr. Girish Budhiraja is the Chief Product and Marketing Officer. He holds a
Bachelor’s degree in Technology in Mining Engineering from Indian School of
Mines and a post-graduate diploma in management from IIM, Bangalore. He is
working with SBI since November, 2012. Previously, he was associated with
American Express Bank Limited, and ICI India Limited.

5
Feb
27,
SBI Cards and Payment Services Limited | IPO Note
Feb 27, 2020
5
Issue details
SBI Cards IPO is raising `500cr (0.66cr shares) through fresh issue and `9,855cr
(13.05cr shares) through offer for sale (OFS). The Promoter, State Bank of India
(SBI) and CA Rover Holding are collectively selling 13.05cr shares through OFS.
Post Issue, SBI’s stake will decline from 74% to 69.5% and CA Rover’s stake will
decline from 26% to 16%. AT upper price band of IPO, SBI and CA Rover Holding
will garner `2,816cr and `7,039cr, respectively.
In this IPO, there is reservation kept for employee of SBI Cards and SBI, along with
this they will also get `75/- discount. Total 1.49cr share are reserved for
employees and shareholders, of this 0.19cr for employee and remaining 1.31cr
share for shareholder of SBI Cards and SBI.
Exhibit 4: Pre and post IPO shareholding pattern
Particular
No of shares
(Pre-issue)
%
No of shares
(Post-issue)
%
Promoter
68,99,27,363
74.0
65,26,33,992
69.51
Investor/Public
24,24,06,915
26.0
28,63,22,803
30.49
Total
93,23,34,278
100.0
93,89,56,795
100.00
Source: RHP Note : Calculated on upper price band
Objects of the offer
The net proceeds of the Fresh Issue are proposed to be utilized for
augmenting capital base and general corporate purposes.
To achieve the benefits of listing the Equity Shares on the Exchanges and to
carry out offer for sale of equity shares.
Risk
Any changes by Indian regulator (RBI) on interchanges fees (spend based fess)
would impact SBI Cards’ financials and return ratio. As interchanges
contribute 44% of other income and 26% of total income.
Presently, RBI does not allow NBFCs to offer their own credit cards. If in
foreseeable future, RBI allows NBFCs to issue credit cards, it will pose the risk
of competition for SBI Cards.
Prolonged slowdown in economy would impact asset quality adversely,
consequently provision costs would go up.

6
Feb
27,
SBI Cards and Payment Services Limited | IPO Note
Feb 27, 2020
6
Income Statement
Y/E March (` cr)
FY17
FY18
FY19
9MFY20
NII
1,360
2,048
2,559
2,527
- YoY Growth (%)
51
25
Other Income
1,583
2,610
3,711
3,747
- YoY Growth (%)
65
42
Operating Income
2,943
4,659
6,270
6,274
- YoY Growth (%)
58
35
Operating Expenses
1,839
2,939
3,790
3,553
- YoY Growth (%)
60
29
Pre - Provision Profit
1,104
1,719
2,479
2,721
- YoY Growth (%)
56
44
Prov. & Cont.
532
800
1,148
1,102
- YoY Growth (%)
50
43
Profit Before Tax
572
919
1,332
1,619
- YoY Growth (%)
61
45
Prov. for Taxation
199
318
469
457
- as a % of PBT
35
35
35
28
PAT
373
601
863
1,161
- YoY Growth (%)
61
44
35
Balance Sheet
Y/E March (` cr)
FY17
FY18
FY19
9MFY20
Share Capital
785
785
837.2
932.3
Reserve & Surplus
664
1,568
2,745
3,819
Net Worth
1,449
2,353
3,582
4,751
Total Borrowings
8,557
12,061
14,718
19,421
- Growth (%)
41
22
Other Liabilities
759
1,272
1,940
1,821
Total Liabilities
10,765
15,686
20,240
25,993
Cash and Cash equivalents
175
312
734
453
Investments
111
275
75
86
Total Loans & Advances
9,983
14,046
17,909
23,933
- Growth (%)
41
28
Fixed Assets
2
121
142
164
Other Assets
495
933
1,380
1,358
Total Assets
10,765
15,686
20,240
25,993
- Growth (%)
46
29

7
Feb
27,
SBI Cards and Payment Services Limited | IPO Note
Feb 27, 2020
7
Key Ratio
Y/E March
FY17
FY18
FY19
9MFY20
Profitability ratios (%)
NIMs
13.5
16.8
15.8
-
RoA
3.5
4.5
4.8
6.9
RoE
25.7
31.6
29.1
37.9
C/I
62.5
63.1
60.5
56.6
Capital adequacy ratios (CAR)
Tier I CAR
11.3
12.4
14.7
15.4
Tier II CAR
4.4
5.9
5.3
3.8
Total CAR
15.7
18.3
20.0
19.2
Asset Quality (%)
Stage 1 & Stage 2 (` cr)
10,064
14,157
18,073
24,164
Stage 3 (` cr)
241
412
453
612
Provision
Stage 1 & Stage 2 (` cr)
159
247
316
433
Stage 3 (` cr)
164
278
301
410
Provision %
Stage 1 & Stage 2
1.58
1.74
1.75
1.79
Stage 3
67.9
67.3
66.5
67.0
Gross NPAs %
2.3
2.8
2.4
2.5
Net NPAs %
0.8
1.0
0.8
0.8
Credit Cost
5.3
5.7
6.4
6.1
Per Share Data (`)
EPS
4.0
6.4
9.3
16.6
BVPS
15.5
25.2
38.4
51.0
Valuation Ratios
PER (x)
188.8
117.1
81.6
45.5
P/BVPS (x)
48.6
29.9
19.7
14.8
DuPont Analysis
FY17
FY18
FY19
9MFY20
Interest Income
17.5
20.9
19.9
20.7
Interest Expenses
4.9
5.4
5.7
5.7
NII
12.6
15.5
14.2
14.9
Provision
4.9
6.0
6.4
6.5
Adj NII
7.7
9.4
7.9
8.4
Other Inc.
14.7
19.7
20.7
22.2
Total Income
22.4
29.2
28.5
30.6
Opex
17.1
22.2
21.1
21.0
PBT
5.3
7.0
7.4
9.6
Taxes
1.8
2.4
2.6
2.7
RoA
3.5
4.5
4.8
6.9
Leverage
7.4
7.0
6.1
5.5
RoE
25.7
31.6
29.1
37.9
Valuation done at upper price band, 9MFY20 valuation done on annualized number.

8
Feb
27,
SBI Cards and Payment Services Limited | IPO Note
Feb 27, 2020
8
Research Team Tel: 022 - 39357800 E-mail: [email protected] Website: www.angelbroking.com
DISCLAIMER
Angel Broking Limited (hereinafter referred to as “Angel”) is a registered Member of National Stock Exchange of India Limited,
Bombay Stock Exchange Limited, Metropolitan Stock Exchange Limited, Multi Commodity Exchange of India Ltd and National
Commodity & Derivatives Exchange Ltd It is also registered as a Depository Participant with CDSL and Portfolio Manager and
Investment Adviser with SEBI. It also has registration with AMFI as a Mutual Fund Distributor. Angel Broking Limited is a registered
entity with SEBI for Research Analyst in terms of SEBI (Research Analyst) Regulations, 2014 vide registration number INH000000164.
Angel or its associates has not been debarred/ suspended by SEBI or any other regulatory authority for accessing /dealing in securities
Market. Angel or its associates/analyst has not received any compensation / managed or co-managed public offering of securities of
the company covered by Analyst during the past twelve months.
This document is solely for the personal information of the recipient, and must not be singularly used as the basis of any investment
decision. Nothing in this document should be construed as investment or financial advice. Each recipient of this document should
make such investigations as they deem necessary to arrive at an independent evaluation of an investment in the securities of the
companies referred to in this document (including the merits and risks involved), and should consult their own advisors to determine
the merits and risks of such an investment.
Reports based on technical and derivative analysis center on studying charts of a stock's price movement, outstanding positions and
trading volume, as opposed to focusing on a company's fundamentals and, as such, may not match with a report on a company's
fundamentals. Investors are advised to refer the Fundamental and Technical Research Reports available on our website to evaluate the
contrary view, if any
The information in this document has been printed on the basis of publicly available information, internal data and other reliable
sources believed to be true, but we do not represent that it is accurate or complete and it should not be relied on as such, as this
document is for general guidance only. Angel Broking Limited or any of its affiliates/ group companies shall not be in any way
responsible for any loss or damage that may arise to any person from any inadvertent error in the information contained in this report.
Angel Broking Limited has not independently verified all the information contained within this document. Accordingly, we cannot
testify, nor make any representation or warranty, express or implied, to the accuracy, contents or data contained within this document.
While Angel Broking Limited endeavors to update on a reasonable basis the information discussed in this material, there may be
regulatory, compliance, or other reasons that prevent us from doing so.
This document is being supplied to you solely for your information, and its contents, information or data may not be reproduced,
redistributed or passed on, directly or indirectly.
Neither Angel Broking Limited, nor its directors, employees or affiliates shall be liable for any loss or damage that may arise from or in
connection with the use of this information..